This post originally appeared on Single Grain, a growth marketing agency focused on scaling customer acquisition.
 Goals matter – just ask any Brazilian soccer fan. Without concrete goals, you have no good way to track your progress or ensure that you’re achieving the things you’ve set out to accomplish. Instead, you just cross your fingers and spin your wheels on directionless projects.
And when it comes to measuring specific goals related to your website or Internet business, content may be king, but Google Analytics is Parliament. This incredibly feature-rich program is free to use and can provide you with a wealth of information on how visitors are interacting with your site. It’s a “must-have” for website owners who are serious about making decisions based on measurable data instead of ill-informed hunches.
There are other platforms available — Clicky, Piwik and Kissmetrics for example — but let’s not kid ourselves. Google is where it’s at, so it makes sense to go to Google for our website data. You don’t go to McDonald’s when you want a steak, right?
And while Google doesn’t release any official numbers for the service, industry watchdogs estimate that somewhere between 30-50 million websites use Analytics as of late 2015.
Google Analytics V5 was launched in March 2011, but was not made standard until much later. Universal Analytics was announced in October 2012, and is currently the only supported version of the tool. In addition to “regular” Analytics, Google introduced the Analytics 360 Suite for those enterprises that want a bit more horsepower.
To clear up any confusion and to help you incorporate this powerful analytics suite into your business strategies, we’ve put together the following guide on how to set up goals and funnels with Google Analytics.
I’m going to assume that you’ve already set up your website with your tracking code (check out this walkthrough if that sentence made you tilt your head and say “huh?”).
In order for Analytics to receive data, you need to add a unique tracking code to every page of your website HTML. You can find it on the Admin tab, in the Property column, under Tracking Info.
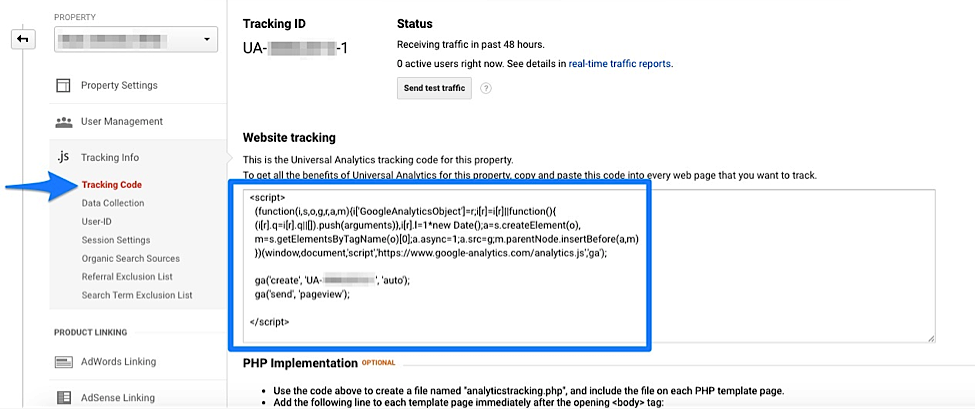
If the thought of working with code makes you break out in a cold sweat, you can opt for an easier plugin implementation, like the very popular Google Analytics by MonsterInsights.
Either way, your tracker needs to be installed before you can start taking advantage of all that Analytics has to offer, goals or otherwise.
And while you’re at it, consider a few of these mistakes to avoid in setting yourself up. Analytics has been around long enough now that there are boatloads of tips, tricks, and best-practice advice. Take the time to familiarize yourself with the basics and the more advanced features to truly harness the power of the platform.
Learn More: How to Track Your Website’s Revenue with Google Analytics
One of the biggest changes rolled out in version 5 was the expanded “event” goal set, which enabled you to collect even more types of data about your visitors’ interactions with your site.
This feature is incredibly powerful, as it allows you to go beyond the simple metrics that Google Analytics tracked before the update (including time on site, number of pageviews, and URL destination visits) to really get a feel for how your visitors are engaging with your site. Since then, the tool has continued to evolve, with new functionality being introduced on a fairly regular basis. The Analytics feature set is so rich that many users don’t fully comprehend everything it can do for them.
With the addition of event goals in 2011, the total number of goal types within Google Analytics now stands at four:
Goal types are organized into either Template (pre-filled configuration), Custom set-ups, or Smart Goals. The goal type that’s right for you will depend on the needs of your particular business model.
A blogger, for example, is more likely to be interested in average time on site or pages per visit than an e-commerce seller, for whom a primary metric might be destination goals that track completed sales when visitors reach a designated “Thank You” or order confirmation page.
Templates will only be provided if you’ve assigned your property an Industry Category. You can find that drop-down menu on the Admin tab, in the Property column, under Property Settings.
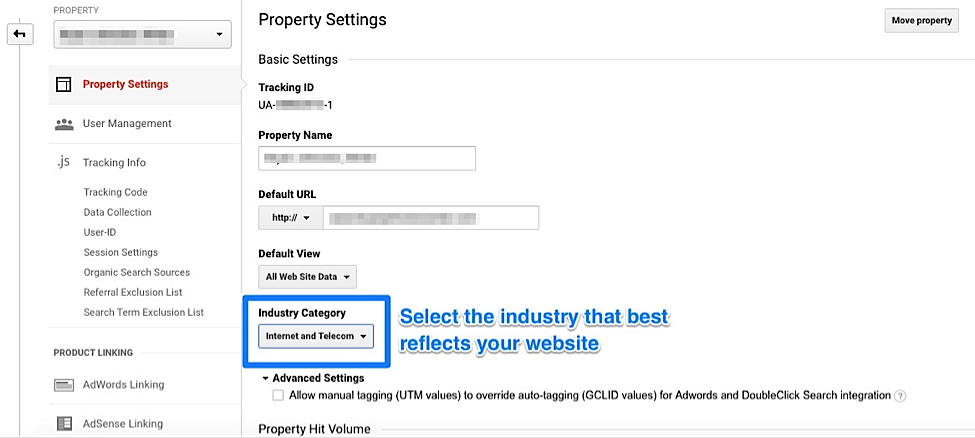
No category, no goal templates (and those offered to you will change depending on which industry category you select). Template goals are arranged into four categories: revenue, acquisition, inquiry, and engagement. If you can create at least one goal in each category, you’ll get a well-rounded snapshot of your visitors and how they’re engaging with your website, product, and content.
Once your category is assigned (don’t forget to save after making that change!), you’ll be able to chose either template or custom on the goals dashboard.
For many users, Smart Goals will not be available. To use them, you must first meet a few prerequisites:
Those requirements will exclude many sites, so we’re going to skip them for now. You can find out more about Smart Goals on your own should you feel analytically ambitious.
Now we get to the nitty-gritty. To set up a goal for your website within Google Analytics, log in to your dashboard, then click on the Admin tab in the upper left-hand corner. This is the administration section of your website’s profile, and it allows you to create goals (found in the View column) among a slew of other tasks:
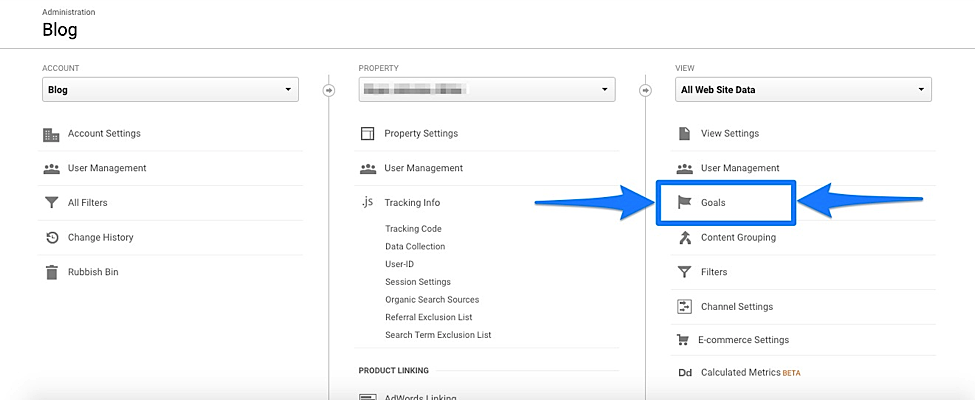
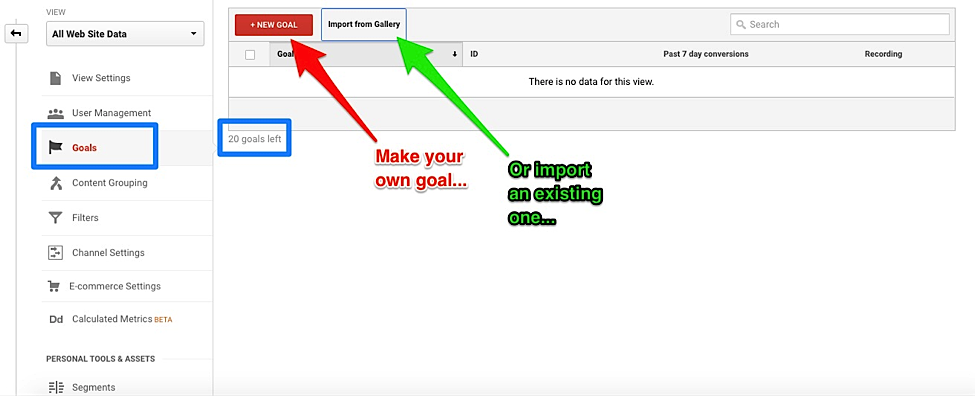
Click on Goals, and you’re whisked away to the goals dashboard. From here, you’ll see that you’re able to use up to 20 specific goals (the number remaining appears at the bottom left of your goal list) for each property. You can opt to create a new goal, or import an existing one from the woefully underappreciated Analytics Solutions Gallery.
Either way, choose them carefully, as you will not be able to delete these later on (although you can deactivate and rename them once you’re finished with a particular goal). You’re limited to 20 goals per View. That’s it. No more.
Click the Import from Gallery button, and you’ll get a pop-up window of the Solutions Gallery.
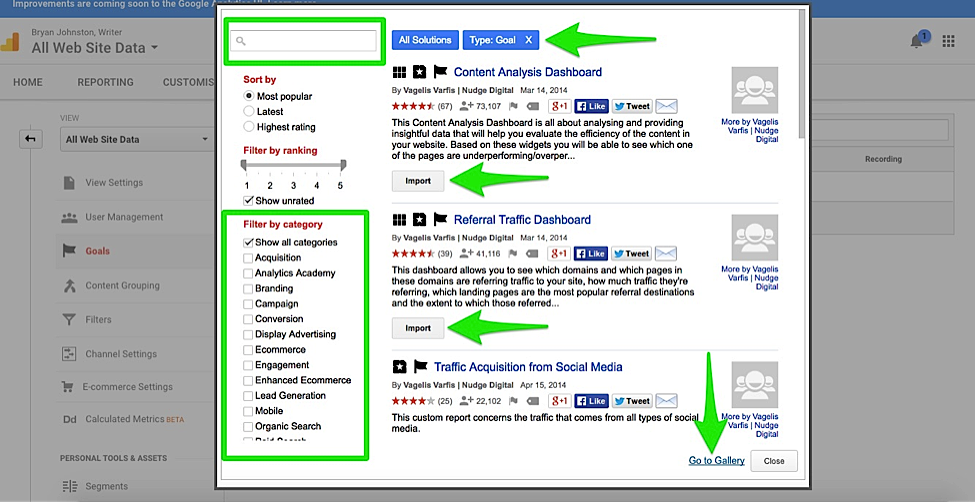
You can use the filters along the left, or the search field at the top left, to find whatever kind of goal you’re in the mood for. Notice that it’s already limited to Goals, there’s an Import button below each result, and you can opt to go directly to the Gallery website if you’d prefer not to work in the window (it’ll open in another tab).
The Solutions Gallery is well worth a visit. Besides user-submitted goals, you can find custom reports, dashboards, and segments, too — everything you need to make Analytics your go-to data destination.
To create a goal yourself, click on the red “+New Goal” button. This will launch the goal selection screen where you’ll be able to pick either Template (as long as you’ve designated an industry) or Custom:
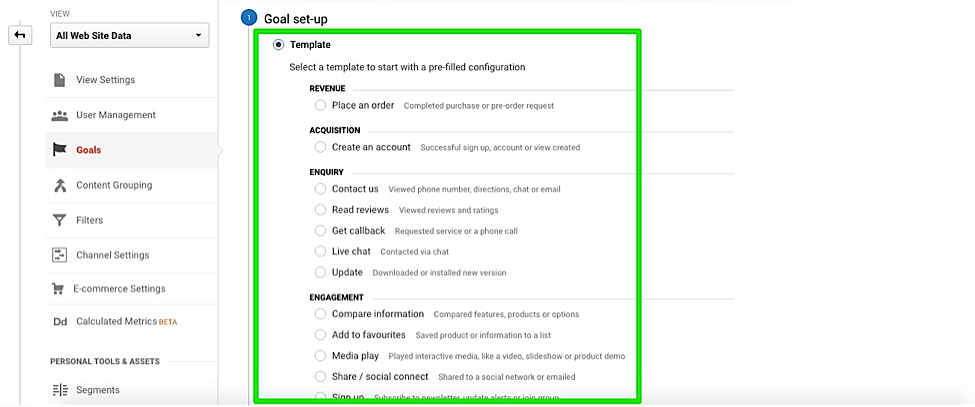
Make your selection (setting up your own goal is easy if you don’t see any template for what you want to do, so don’t fear the Custom option!), and hit Continue.
Under Step 2, you’ll be asked to give your goal a name and choose the specific type of goal you’d like to create.
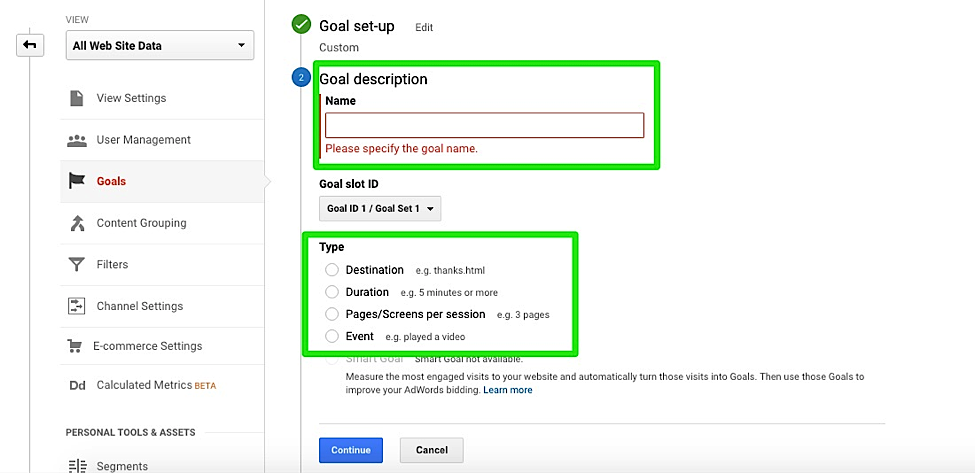
Not sure which one to choose? Let’s take a closer look at each type…
Destination goals are wonderful for tracking conversions if a particular action (purchase, download, sign-up) results in a visitor arriving at a particular page, like order confirmation or a “thank you” page.
In the web page URL field, you only need to input the extension — such as /thankyou.html — and not your entire web address (www.yourwebsite.com/thankyou.html, for example).
And if you’re not sure what the destination URL is, you can quickly find out by performing the conversion yourself: go to your website, fill in the form (or download the infographic, or send a note, or whatever), and make note of the URL of the page after you complete the action. That’s your destination goal URL.
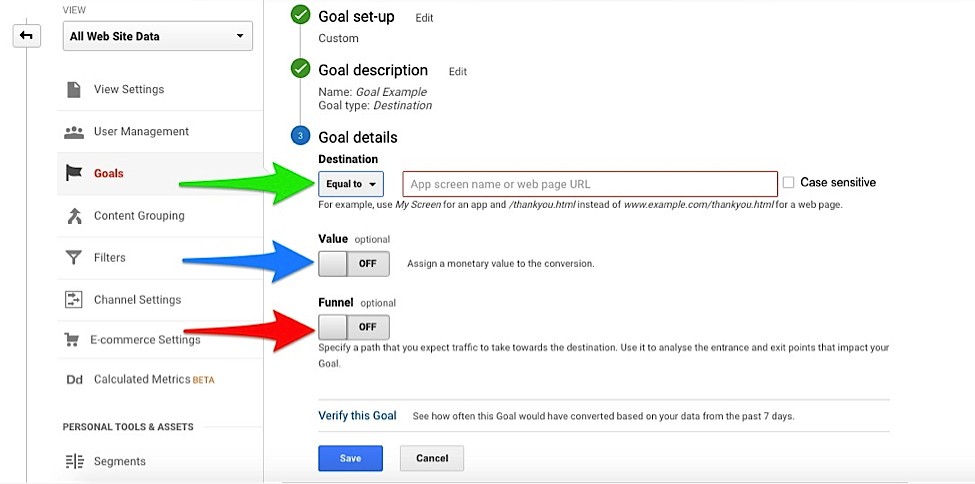
Enter the URL of your designated conversion page in the appropriate field. A destination page can be:
If you know how much a goal conversion of this type is worth to you, turn on and enter it into the Value field (for example, if you know a “thank you” page visit occurs only after a $10 report has been purchased, enter “10” as the value).
The default currency is U.S. dollars, but you can change this under Admin > View > View Settings > Currency Displayed As. And if you want to track transactions for an e-commerce site, you’d be better off installing and using the Enhanced E-commerce plugin, and leaving this blank (but that’s a subject for another day).
If your final destination URL is part of a larger funnel — as in the case of one-time offers, upgrades, and other multi-step sales processes — turn on the Funnel option and enter the URLs of each step in the sales path. You can add up to ten.
A funnel in Analytics must be attached to a goal. For example, to get to the “Thank You” page indicated as the destination goal, your customers might have to travel from a landing page to a sign-up page before arriving at the destination page. You would enter the first two steps into the funnel fields.
Funnels should be used if visitors must follow a specific path to reach a destination that you want to track (be sure and turn on the Required? button). They can help identify leaks (pages within the funnel where visitors are bailing without completing it) so you can hypothesize and test ways to stop those leaks and stay afloat.
There’s a great funnel report with data for each step available under Reporting > Conversions > Goals > Funnel Visualization.
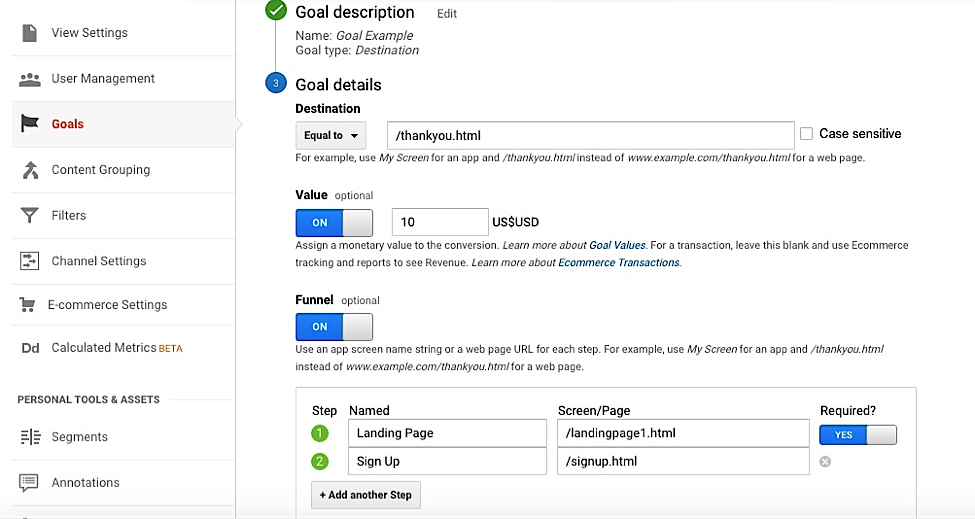
Finally, verify the goal and click save.
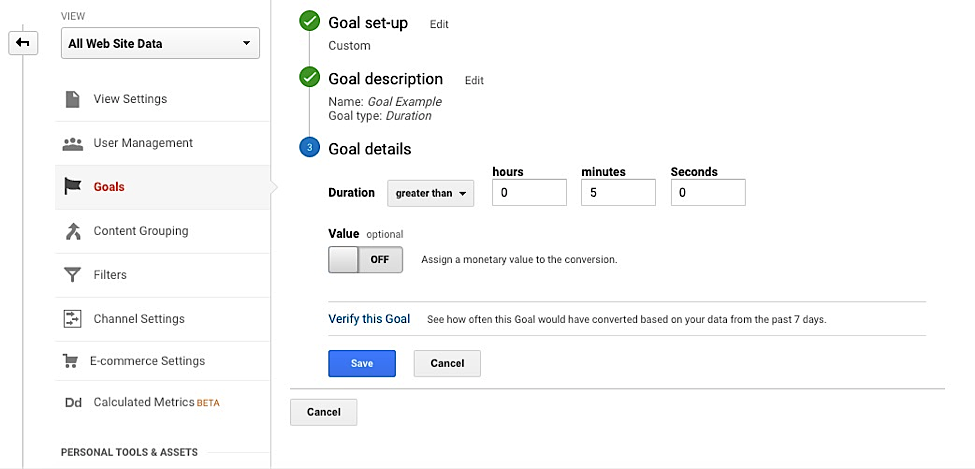
If your goal is simply to measure and increase the length of time visitors remain on your site (their engagement with it), select the “Duration” option.
Enter the specific amount of time on site — either by hours, minutes, or seconds — that you’ve set as your goal, then click “Save.” The goal will be recorded as complete only after someone hits the indicated duration.
Working to increase the session duration of your visitors (and lower the bounce rate) can have an indirect influence on your SEO. Upgrade your content, improve site navigation, make it more visually appealing, and offer more than what you’re offering now.
Again, if you happen to know or have a value, enter it in the appropriate field, although it’s much harder to place a numerical value for time spent on site. What is five minutes worth to you? Is ten minutes worth double that?
Related Content: 10 Ways to Measure Social Media Engagement (Plus 7 Tools to Track It!)
Another good indicator of overall engagement is pages/screens per session. Using internal links and other calls to action to encourage visitors to move amongst the pages on your site is a good way to get people to engage with your brand and learn more about your company.
To set this as a defined goal, select the “Pages/Screens per session” option and indicate how many pages will trigger a goal completion.
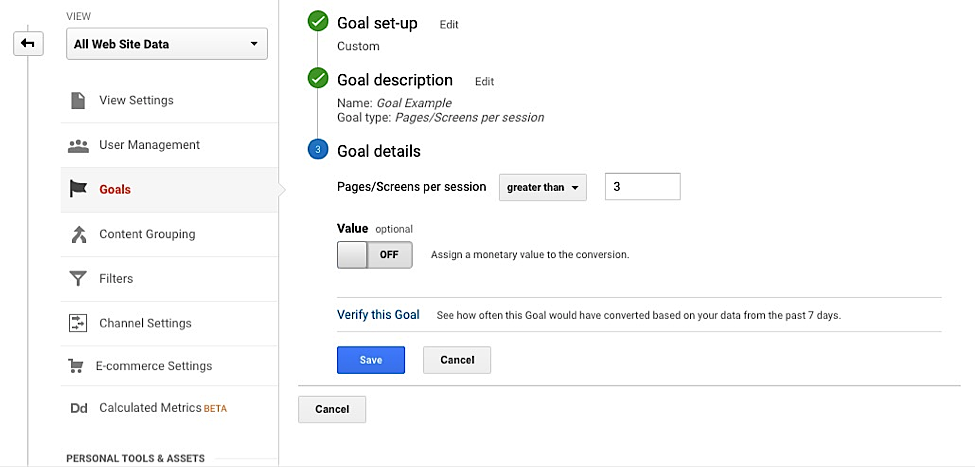
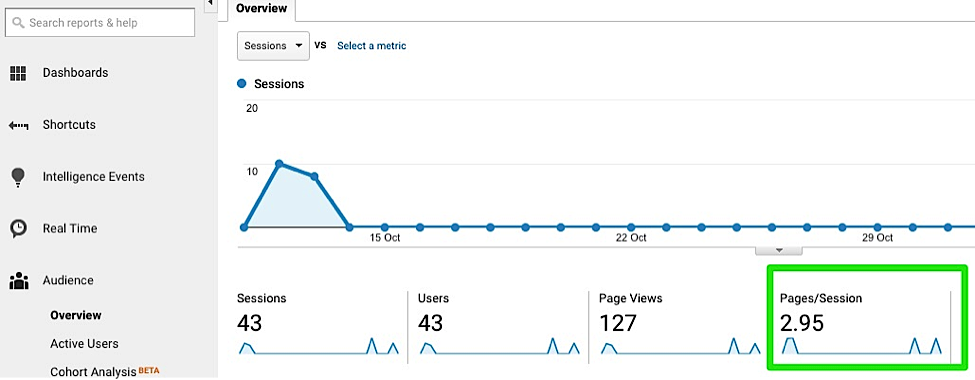
Take a look at your existing stats and set a goal that’s one or two pages higher than your existing average pages per visit. You can find your current statistic under Reporting > Audience > Overview (you can also see your average session duration here, too).
Another good stat to build out from is your Page Depth, found under Audience > Behaviour > Engagement, and then select Page Depth on the report itself. This will show you exactly how many sessions looked at one page, two pages, three pages, and so on. The more sessions with higher page depth, the more your site is resonating with visitors.
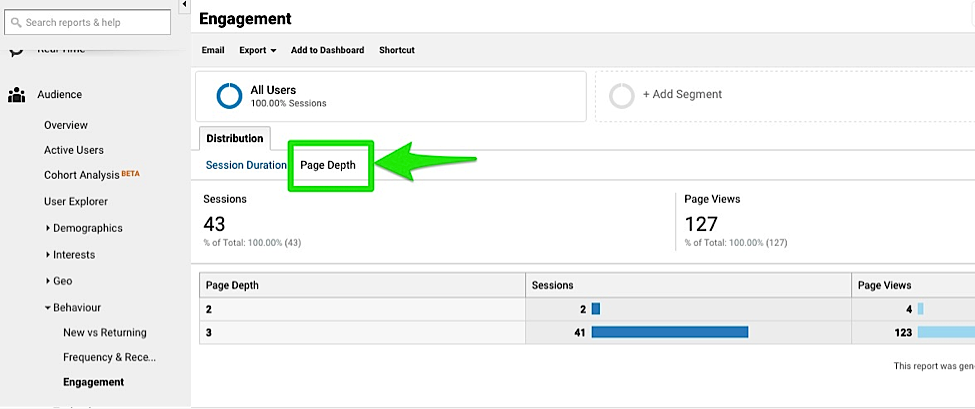
As you make changes designed to encourage longer site visits — in both duration and pages per session — and start meeting your goals, come back and increase the amounts as needed. Always be working towards longer visits and more pages per session to truly connect and captivate your audience.
Setting up an event goal in Google Analytics is a little more complicated, as there are several variables that can be used depending on what you want to track. An event is an action that happens independent of a page load, so you can’t use a destination as a trigger.
Counting the number of times a video is played will require different tracking parameters than will be needed to count the number of times your pages are shared on Facebook, or how often something is added to a cart.
Related Content: Complete Guide to YouTube Analytics
When you click the “Events” option in Analytics, you’ll see the following screen:
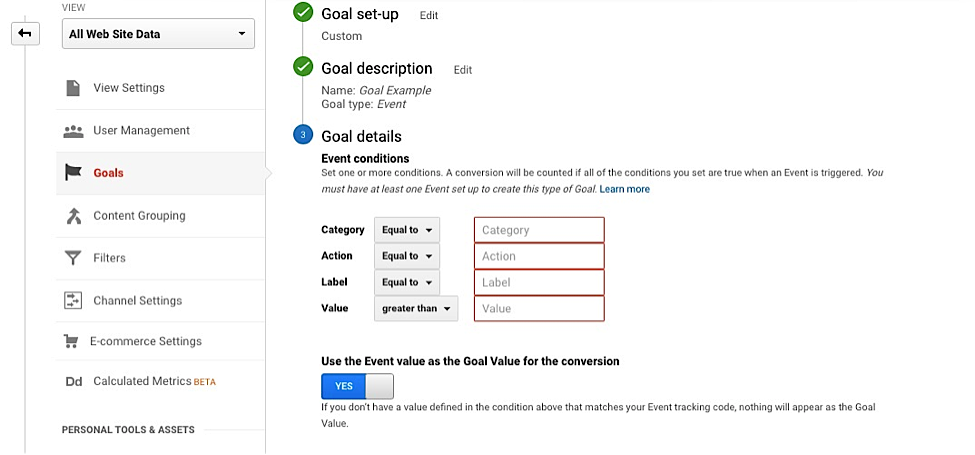
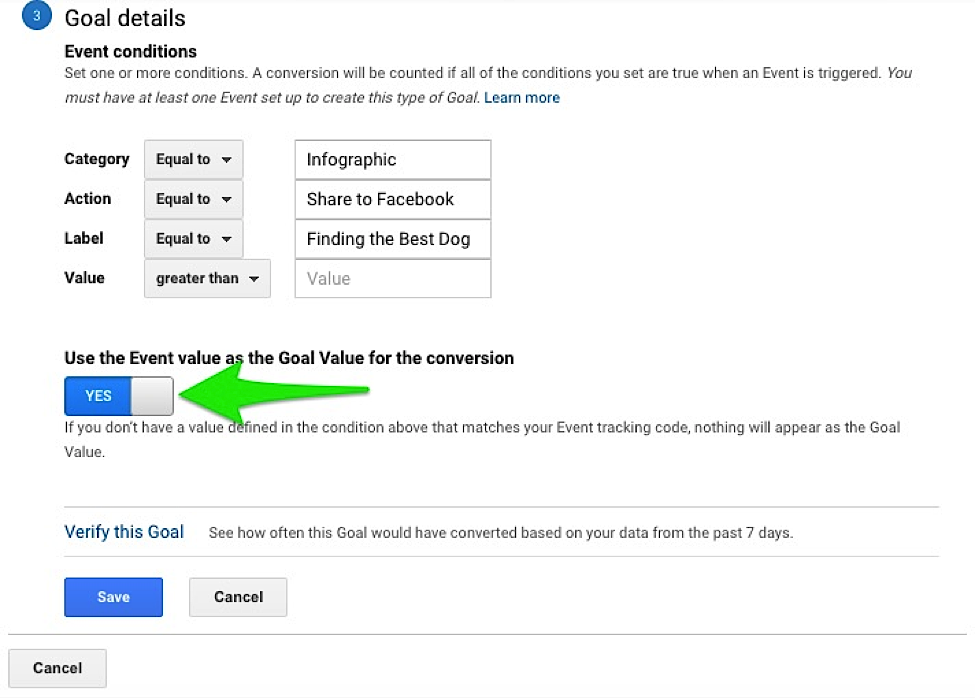
To understand what each of these fields means — as well as how to use them to set up event goals on your site — check out Google’s complete Event Tracking Guide. Be aware that some of the information gets a little technical, and that you may need to append links or other elements of your site with pieces of code for the tracking to work properly. This goal requires a lot more than the first three types.
Each event goal is comprised of four parts:
Only the first two are necessary for a goal to trigger, but it’s worthwhile to include them all to get the most accurate, detailed reports possible.
The Value field does not necessarily have to be a monetary amount, and you can opt to either input the goal value from the event value, or to enter a separate dollar value by selecting “No.”
If this all sounds too complicated, consider hiring a web developer (shameless plug: Single Grain!) to set up event goals on your website for you. You’ll incur a small fee to have this feature added, but the incredible amount of invaluable information that these goals can generate for you far outweighs the set-up cost.
You can find a complete list of your created and imported goals on the Admin > View > Goals page. You’ll see the goal name, its ID, the number of successful conversions in the past week, and how many goal slots you have left for a given Property.
You’ll also notice a “Recording” on/off switch for each goal where you can pause it and stop receiving data (if it stops being relevant data for you to collect).

Once you have a few goals set up and doing their thing, you’ll receive data every time a conversion happens and the goal is triggered. You’ll be able to analyze and evaluate them under Reporting > Conversions > Goals on the Analytics dashboard.
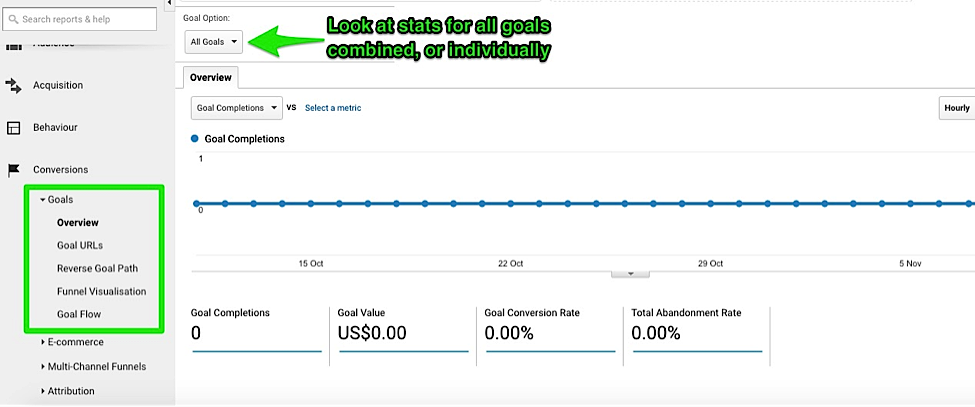
You’ll see stats on the number of goal completions, your goal conversion rate (number of goal completions / number of visitors x 100), goal value (assuming you assigned one somewhere along the way), and total abandonment rate on the Overview dashboard (for either all goals combined, or individual goals, and you can change it with the drop-down menu directly on the report itself).
Other reports are available on goal URLs, reverse goal paths, funnel visualization, and goal flow.
Traffic is good. Setting up and measuring conversion goals is better.
Conversion goals should be a part of any complete Google Analytics strategy and plan, as they track and monitor some of your most important KPIs. Take the time to create a few goals if you haven’t done so already, and read up on the the how and why of Analytics. It’s a powerful but still underutilized tool to help your business grow, connect, and succeed.
Now that you know how to set up goals and funnels with Google Analytics, you’re ready for a successful 2017!
Enter your email to get free instant access