Aug 6, 2020
Ecommerce advertising: a data-driven guide for choosing the best ad channels and tactics
15-MINUTE READ | By Kaleigh Moore
[ Updated Mar 8, 2023 ]
An enormous ad budget solves a lot of problems.
Which advertising channel should you try? Try them all and see what sticks. Which types of ad copy should you run? A/B test until your audience tells you the answer.
But with a limited budget, you’ll have a limited sample size. You have to solve those problems with good data management and basic analytics skills.
Between all of the available channels — from Facebook Ads to Snapchat — how can your company run effective ecommerce ads with a limited budget? How do you know which channel works best with minimal testing? And how can you settle on the messaging best suited for your target customers?
There’s no single answer, but there are ways to find out. That may require using several different channels, running multiple campaigns, and using educated guesses. Your goal: to craft a precise advertising campaign that squeezes out all the relevant data you can handle. Here’s how to do it.
How to choose your ecommerce advertising channels
1. Know your audience
With limited knowledge and sample size, how can you learn about your audience? The answer is simple: do plenty of research before you spend your first dollar on advertising.
One way to do this is to match your customer avatar or persona with your knowledge of the major advertising and social channels. Match the medium with the message. Study the demographics of each channel’s audience.
This doesn’t require a single dollar of ad spend. But it can help you to hone your messaging before the campaign launches. Let’s explore what we know about these channels:
Instagram’s demographics trend lightly towards a younger, female audience, but with a large enough audience to handle a variety of target markets.
- 120.7 million total Instagram users from the U.S., but 89% of its overall users are from outside the U.S.
- 56.3% of Instagram users are female.
- 73% of U.S. teens are happy to receive messages from brands about new products or promotions, naming Instagram the best channel for it. Over one-third of Instagram’s global audience is in the key demographic between 25 and 34.
- Best industries: Apparel, makeup, and jewelry, as well as associated industries.
Snapchat
Snapchat’s figures hint at a surprisingly large and diverse audience. One thing that stands out: Snapchat is young. On any given day, 41% of 18-to-34-year-olds use the app.
- Snapchat has shown remarkable growth. Not long ago, just two percent of people over 35 were using the app, which has since grown to 14%.
- Snapchat has seen similar growth with younger users, moving from 5% of smartphone users 25-34 to well over a third: 38%.
- New signups continue to show a trend towards youth, with more than half of new users under the age of 25.
- Women tend to use Snapchat more often than men, with 42% women vs. 31% men from 18-29 reporting that they used the app.
- Snapchat tends to work best with an average order value of less than $100.
Facebook’s audience is so large, it tends to reflect Internet use as a whole. In fact, on the entire Internet, the majority of people (83% women, 75% men) use Facebook. But there are some individual quirks worth noting:
- Facebook users trend 54% female and 46% male.
- Facebook’s demographics trend older compared to the other channels on the list, with 62% of seniors online (65 and older) on Facebook. In the age group before that, 50-64, 72% are on Facebook.
- Of those people aged 30-49, 84% are on Facebook.
- With such a wide range of demographics available, the key will be honing your Facebook ad spend to your exact demographic before you ever launch your first ad.
Google Ads
Like Facebook Ads, Google Ads are highly customizable by demographics. Part of that is due to the platform itself. It’s massive. But here are a few things we can learn from Google advertisement statistics:
- Google owns 71% of the search market share, which is one of the largest audiences on the entire web. Other estimates have the share much higher, such as Statista, which points to 86%.
- With Google Ads, you’re also competing with the searches themselves. But statistics point to 65% of people preferring ads when these ads properly align with buyer intent. That means the trick will be in creating relevant ads that answer the question posed by the search query.
- Best industries: Less visual products. For example, information products, software-as-a-service, and other intangible products tend to do well on Google Ads because of the nature of the platform.
Understanding demand generation vs. demand capture
There are two ways to maximize advertising performance with these channels: by generating new demand or by capturing existing demand.
In demand generation, you’re looking to create demand for the product/brand. Internet display ads, especially those that feature prominent visual displays, are examples of demand generation strategies. So are social media posts and online video ads.
With demand generation, you’re looking to introduce yourself. This is particularly well-suited for clothing brands, homeware, kitchen equipment, and other brands with visual elements.
Demand capture looks to convert existing demand. If you work in an industry where there’s existing demand for a service, you’re looking to capture that demand with effective Google Ads, for example. In Google’s advertising platform, you’re hoping to get your ad in front of people who are already interested in buying a product similar to yours.
Since you have a limited budget, it’s up to you to define which strategy will work best. This will help you select the most appropriate channels for your early testing.
2. Start small
Once you know a bit more about each channel’s demographics — and whether your product is suited for demand capture vs. demand generation strategies — you’re ready to start crystalizing these insights into a campaign.
“Marketing spend and strategy should drive to clear business goals, so identify the primary objective (revenue; profit; more customers; etc). After that, establish total marketing KPIs (e.g. cost per acquisition, sales, return on ad spend) and use a weighted average to assess the success of the total program. Use the same KPIs to dive in by channel.” -Marjorie Chelius, Director of Acquisition at Native
The key here is that every campaign you create should include tangible metrics. You want to measure direct sales from each campaign. You’ll want to create apples-to-apples comparisons in your analytics. For example, don’t compare the results of a brand awareness campaign (high traffic) against direct sales from a sales campaign (high conversions).
Beware of vanity metrics
Vanity metrics refer to data that might be tangible, but isn’t relevant to your goals. The complication is that it can be difficult to tell between vanity metrics and actionable data. There’s no single rule of thumb for what is “vanity” and what isn’t. It depends on your needs.
But as Tableau notes, there are generally three ways you can discern the difference:
- Do these metrics drive business decisions? For example, an ecommerce store has to look at sales, rather than traffic, to determine which product has true demand.
- Is this experiment repeatable? Your data may seem relevant, but unless it potentially fuels a new test or a new campaign based on a hypothesis, it may not be as relevant as you thought.
- Is the data relevant in its context? Tableau asks whether metrics reveal an essential truth. We’d say to put data into its proper context. For example, a company that grows sales by 500% is doing well–unless it started with extremely low numbers and still hasn’t increased sales to justify its ads. In data, context is everything.
Small budget, limited variants
There are two ways to start small: small with your budget, and limited with your ad variants. It’s easier to add more money to the budget later. You can also add additional campaigns and ad variants as you go.
But even as you start small and have little else to go on, be wary of drawing conclusions from the limited sample size.
Ecommerce advertising expert Savannah Sanchez recommends starting small with the following strategies:
- Create a minimal amount of ad sets. Run a maximum of 15 ad sets so you can generate meaningful data right out of the gate.
- Minimize audience overlap. Don’t compete with yourself at first. Minimize audience overlap by runnin distinct campaigns.
Use consistent naming conventions
As you work through the various platforms, keep the naming conventions on each campaign consistent. This requires additional setup time, but it pays off when it comes time to measure your results.
Make sure you include the goal, the campaign period, the targeting intended with the campaign. You may even include the audience type (warm vs. cold) in each campaign name. Remember: with a limited ad budget, you always want to compare apples to apples later on. You simply won’t have the flexibility for any wasted time.
Be smart about split testing
“Sustainable and scalable growth isn’t possible without experimentation.” -Pooja S, Director of Marketing at Ripen.com
Split testing is useful, but it also gets expensive. To keep its impact on your budget to a minimum, try to test one variable at a time. The higher-level the variable, the more pertinent the results.
Make sure you also thoroughly document the results so you get the most out of each campaign. Consider testing the following:
- Ad channel selection
- Audience targeting
- Messaging (high-level messaging especially)
- Copy: Isolate different copy variants of the same high-level message
- Creative format (for example: video or still image?)
- Creative variant (different images against each other, or different videos against each other)
3. Monitor results
Creating your campaigns with the steps above in mind will be half the battle. You’ll set up your campaign measurements for easier direct comparisons. But when it comes time to monitor results, it doesn’t hurt to know a few best practices.
“Start with a couple of campaigns, learn how they work, learn how your customer works within your ecosystem, and only then you can start to expand to other channels. Performance comparisons depend on what your goals are.” -Nik Sharma, CEO of Sharma Brands
Build a dashboard with Google Data Studio (or your tool of choice)
Perhaps the easiest (and cheapest) way to track your ad campaigns’ results is by using Google Data Studio, which is a free data visualization tool. This will give you access to the data you need in a single, consolidated dashboard. It’s time-efficient and makes for easier apples-to-apples comparisons.
- If you’re testing multiple channels, you can use this template as a starting point.
- If you decided to go with Facebook Ads, you can use a different template.
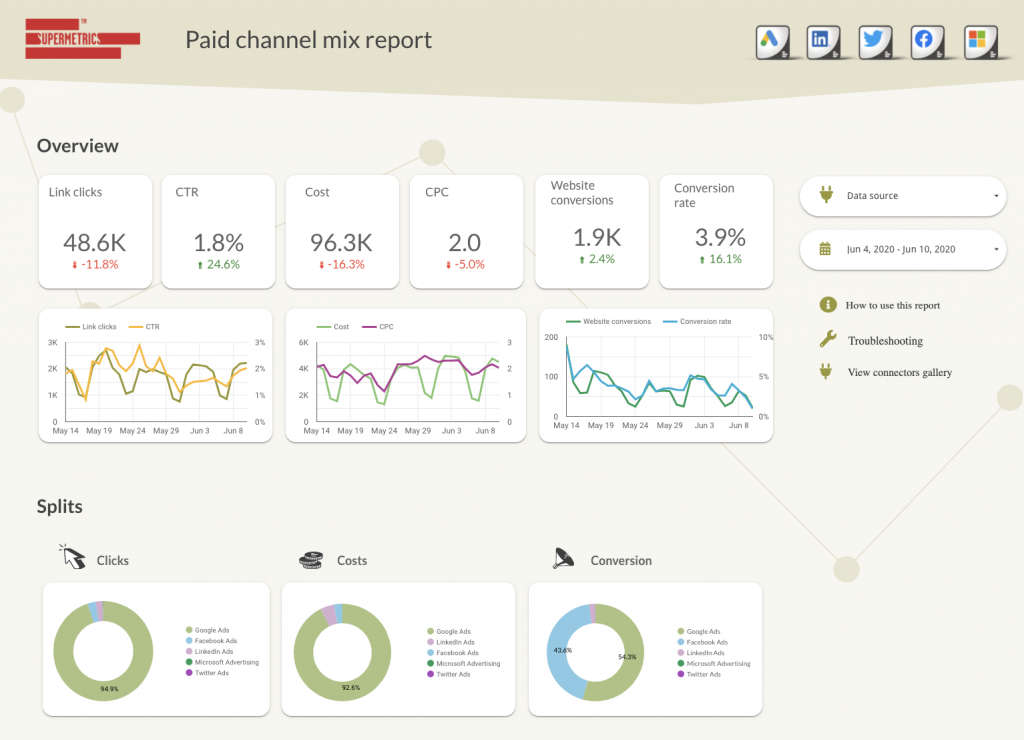
When you launch a new campaign, your sales and advertising data can be scattered and even illegible. Supermetrics helps by cutting through the clutter and bringing all of your key metrics into a Google Data Studio dashboard.
The result? You can analyze your results and compare the ROAS of different channels and campaigns. And you can do it without copy/pasting data from multiple sources.
Optimize your budget allocation and campaigns based on results
As you monitor results, always weigh directly comparable data. For example, monitoring the return on ad spend across two different channels helps isolate which one is the best investment.
Comparing traffic data in one channel with sales from another? Not so much.
In other words, keep your eye on the prize. With a limited budget, return on investment is even more important.
As you gather data, you’ll get an idea of which creative variants are performing poorly. You can drop those and divert more of your budget to variants that are performing well.
When you have a large enough sample size, analyze your data. Look for new hypotheses to test. Where is the data leading you? What new questions replace the old ones?
Once you learn what’s working, stick with it. But don’t forget there are plenty of external variables that may affect your ad performance. Don’t permanently rule out an idea based on a single experiment in a single channel. Stay open to where the data leads you.
Customize your ads to suit your market
If you want to compare channels, make sure that you create apples-to-apples comparisons by using the best practices for each channel. Simply put, what works on Facebook will be different than what works on Instagram, and vice versa. Here’s what you’ll need to know.
- Ad specs: Instagram ads are highly visual. You’re dealing with images of 1080 x 1080 pixels with landscape (1.91:1), square (1:1), or vertical (4:5) traits with a maximum file size of 30MB and maximum captions of 2,200 characters.
- You have 1-3 sentences to make an impact on Instagram. The emphasis is on the visuals. Anything overtly “sales-y” is a no-no, but you do want to provide essential details for anyone intrigued by the visual.
- Best practices? Colorful, sharp images that stand out. Using engaging questions or action verbs to make the most of your 1-3 sentences. Skip to the next step, using action words like “Try,” “Start,” “Sign Up,” or “Begin.”
“Instagram would be my go-to if I were working with a limited ad budget. It works with a lower investment than something like YouTube, is easier to create, and has cheaper ad buys.” -Vincenzo Landino, President of aftermarq.com
- Ad specs: Look for either “Sponsored Posts” (which show up in timelines) or right-hand column ads. When you have a limited ad budget, optimizing an ad for either/or (as opposed to creating the same ad for each format) doesn’t cost anything but extra time. You can read more about Facebook ad specs here.
- Facebook also has a variety of ad formats: stories, video, carousel, slideshow, etc. Choose the one that best suits your product’s strengths.
- As with Instagram, keep the copy that accompanies your Facebook ad direct, clear, and actionable. Make sure your copy lines up with the visual you present.
- Ad specs: Google’s display ad network is highly diverse and even includes different specs by region.
- Google’s different ad formats include text ads, image ads, app promotion ads, shopping ads, dynamic search ads, and more.
- As with Facebook, the type of copy you choose will depend on the medium of the ad itself. With Google text ads, for example, you’ll be limited to 90 characters per description. You’ll have to find a way to make every character count.
- Think in terms of clear benefits and action words. Someone may only glance at your Google ad for a split second. Match your action words with the intention behind each search query to maximize the relevance of your ad.
- Spend a lot of time on headlines especially. For example, for someone looking up jewelry. Don’t repeat what they’ve already done. “Looking for jewelry?” is less effective as a headline because they’re already looking for jewelry.
- Remember demand capture vs. demand generation. With Google, you’re writing ads with demand capture in mind. Move them to the next step.
Snapchat
- Ad specs: With Snap, it’s all about video and visuals. The ideal video length is 3 to five seconds on Snapchat. You can use gifs, stills, cinemagraphs, but only choose one per ad set.
- Keep the copy short and clear. Remember the 3-5 second rule. Copywriting should be similarly crisp. Can you get it under ten words? Three words? Make it a challenge.
- You can add a 1080 x 1920 image that can be converted into a 5-second video for ad purposes. You can also include attachments, upon which Snapchat will apply a call to action at the bottom of the ad.
- Match your brand name to the paying advertiser, as well as to the relevant headline words.
- With Snapchat, make sure your ads are for people aged 13 and up.
- Same with Facebook: always go for relevancy when it comes to the target demographic. Snap allows for plenty of filtering by demographics.
- Build videos and graphics with the vertical smartphone experience in mind.
Stretch your ecommerce advertising dollars
Why bother learning the channels and their individual quirks? Because every advertisement you write that matches your audience means less money spent on learning on the fly. Here’s what you should take away:
- Customer specificity. Remember the demographics of each channel and match your message. The more specific you are about learning who your ecommerce customers are on different platforms, the less time you’ll spend honing down your campaigns.
- Monitor results with apples-to-apples comparisons. It’s not enough to just monitor results. You have to have key goals in the data so you know what you’re looking for. For instance, is one channel offering a better ROI per dollar than the next? Make sure you’re not making faulty assumptions from a limited data set.
- Test before you roll out larger campaigns. Find the signals in the noise. Which ads perform better than others, and what have you learned about these ads that will let you roll out a larger campaign?
With a limited budget, you have to be smart about the way you advertise your ecommerce products. That’s all the more reason to get clear with your campaigns.
None of it happens without effective metrics. That’s why we recommend starting a free 14-day trial of Supermetrics for Google Data Studio. It will help eliminate the guesswork of smaller campaigns so you can define your real-world results, refine your ads, and improve your ROI.
Turn your marketing data into opportunity
We streamline your marketing data so you can focus on the insights.