Jun 4, 2020
Ecommerce analytics 101: A marketer’s guide to driving more online sales with data
19-MINUTE READ | By Kaleigh Moore
[ Updated Jan 13, 2023 ]
In ecommerce and DTC, your customers have all the power. They’re armed with reliable product reviews from their peers, the ability to quickly compare prices between online stores, and the opportunity to vote with their wallets.
Their expectations are high and to give them a reason to buy from you, you need to offer them the best possible online shopping experience.
No matter how you slice it, there’s only one thing that will help you do it right: data.
And that’s where ecommerce analytics come in.
What is ecommerce analytics?
Ecommerce analytics is the process of gathering data from all areas that have an impact on your online store and using this information to understand the trends and the shift in consumers’ behavior to make data-driven decisions that will drive more online sales.
Ecommerce analytics include metrics related to the full customer journey from discovery, to acquisition, to conversion, finally to retention and advocacy.
The importance of ecommerce analytics
The evolution in consumer demand, combined with technological innovations, will continue to drive growth in global ecommerce sales. According to Statista, the number of people buying goods and services online is expected to reach 2.14 billion in 2021, up from 1.66 billion global digital buyers in 2016.
What’s even more impressive is the fact that the industry is forecasted to double in size within the next two years and grow from 3.53 trillion US dollars in retail ecommerce sales in 2019, up to 6.54 trillion US dollars in 2022.
The key drivers of success over the next decade will be centered on building a deep understanding of and connection to the empowered consumer, and the only way to understand consumer behavior is to measure and analyze.
Data from Deloitte shows that 49% of respondents say that analytics helps them make better decisions, 16% say that it better enables key strategic initiatives, and 10% say it helps them improve relationships with both customers and business partners.
Yet, it seems that companies are having a hard time navigating through all the numbers. As reported by Profitero, for 51% of brands, “measuring and reporting on how ecommerce is performing as a distribution channel” is a top challenge.
Over the past two months, there has been a huge year-over-year (YoY) increase in ecommerce due to the coronavirus outbreak. According to CCInsight, U.S. retailers’ online YoY revenue growth is up 68% as of mid-April, surpassing an earlier peak of 49% at the beginning of 2020.
Challenging times are the catalyst for growth. This once-in-a-generation shift we’re witnessing will have a profound impact on our lives, and it will emphasize even more the importance of ecommerce.
Companies that want to take advantage of the increased traffic and online sales, but also get ready for the new normal have to understand data and rely on ecommerce analytics.
5 key areas of ecommerce metrics
When it comes to ecommerce metrics, one common mistake companies make is they get overwhelmed just by thinking how much information they need to gather. So in most cases, they decide to make their decisions based on a gut feeling instead of real insights.
The truth is, there are plenty of metrics, but you need to start with the essential and look at the big picture.
To make things simple and clear, we’ll separate the most important ecommerce metrics in 5 pillars that cover the whole customer lifecycle.
1. Discovery
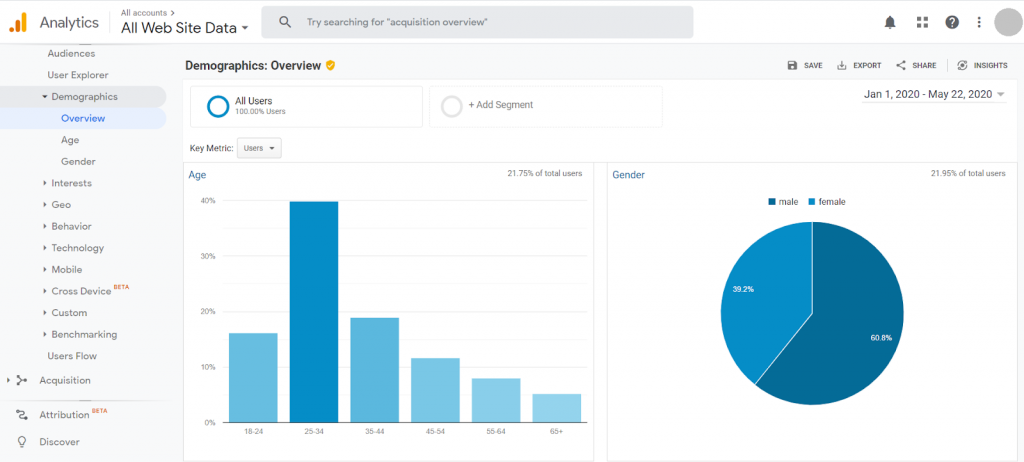
First things first. You have to gather information for your audience and create awareness that will lead them to your online store. In Google Analytics, you can find demographic information about your visitors, like age and gender, but also data on their geographic location, interests, and behavior. These insights can help you create user personas.
Besides these basic metrics, you should also pay attention to the email and social media engagement metrics:
Reach — the number of people who have seen your email or content on social media. Here we talk about your subscribers and social media followers, and the best way to improve this metric is by regular campaigns to get more people to sign up or follow you on social media.
Impressions — the total number of times people saw your post. Unlike reach, where we talk about unique users exposed to your content, impressions are always higher than reach, as one person can have multiple impressions for a single piece of content.
Engagement — another vital metric is the number of followers and subscribers that engage with your content. The rewarding feeling of getting likes and shares is the ultimate goal of regularly communicating with consumers across channels.
When it comes to organic search, analyzing metrics like search volume and keyword rankings can give you great insights on where you should focus your ad spendings and make it easier for consumers to find you.
2. Acquisition
Moving to the next step: measuring the number of consumers that visited your store and the cost of acquisition.
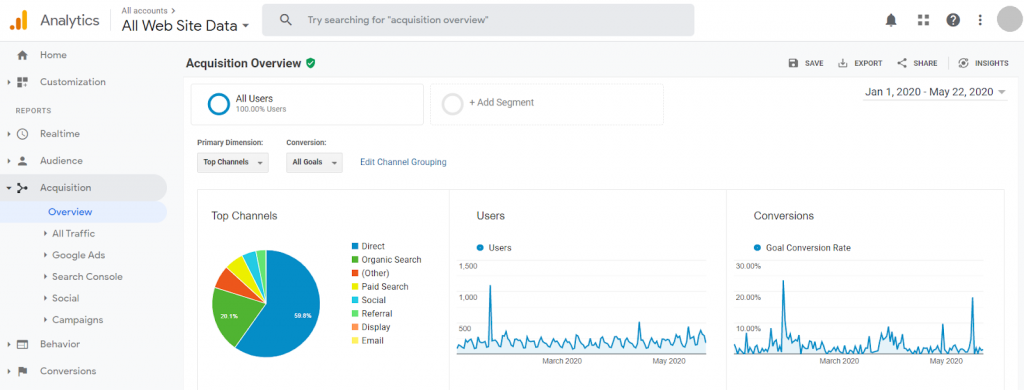
All the time and money you invest in the discovery phase is worthwhile if visitors actually get to your online store. Google Analytics gives a great overview of different channels’ performance and goal conversion rates.
Here are some metrics that you should have in mind related to customer acquisition:
Click through rate (CTR) — the percentage of users who click on a specific link, to the number of total users who view an email or social media post

Cost per lead (CPL) — the average cost of generating new business leads

Cost per acquisition (CPA) — this metric goes one step further and measures the average cost of acquiring a customer

3. Conversion
Now that you’ve managed to bring visitors to your ecommerce store, it’s time to convert them into customers. Unfortunately, not everyone that visits your store will end up clicking the add to cart button.
What’s more, even those who click that button, might change their mind and leave your website. Using the following ecommerce conversion metrics can help you keep track and optimize your online shopping experience along the way:
Sales conversion rate — the percentage of visitors who make a purchase on your online store; increasing the traffic to your website will help you reach your target sales.

Average order value (AOV) — the average amount of money spend when a customer places an order on your website

Cart abandonment rate — the percentage of shoppers who add products to the shopping cart but abandon your store before completing the purchase

4. Retention
Smart businesses know the value of loyal customers. Being able to retain customers pays dividends in the long run. Always have in mind that acquiring new customers is way more expensive than retaining existing ones. On top of that, increasing customer retention rates by 5% increases profits by 25% to 95%, according to research done by Frederick Reichheld of Bain & Company.
Here are some of the metrics that can help you measure customer retention:
Customer lifetime value (CLV) — represents the total amount of money a customer is expected to spend in your business, during their lifetime; one of the main goals for every company is increasing this value

ACL = Total customer lifespans / Number of customers
CV = Average purchase value (APV) / Average purchase frequency rate (APFR)
APV = Total revenue / Number of orders
APFR = Number of purchases / Number of customers
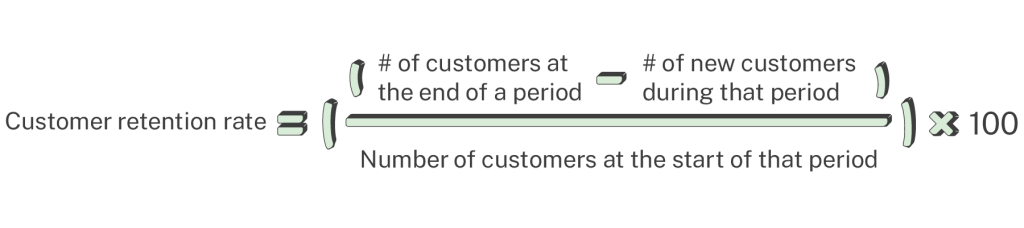
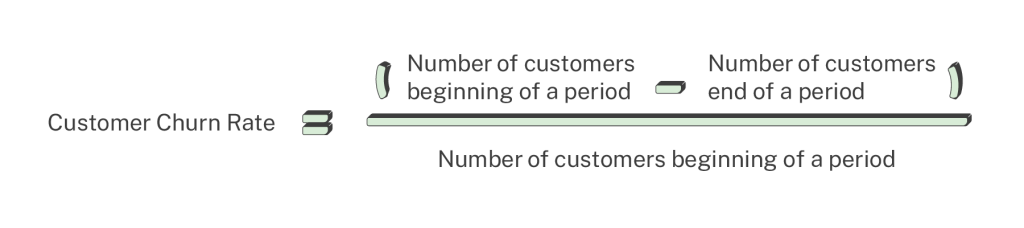
Customer retention rate vs. churn rate — customer retention rate represents the percentage of customers the company has retained over a given period. Opposite to that, the churn rate is the percentage of customers a company has lost over a specific period

5. Advocacy
Shoppers that reach this stage are far more than regular customers. They are your brand ambassadors. Not only do they love your products, but they’re also telling their friends and family about it. This stage of the customer’s lifecycle is often overlooked, and that’s a huge mistake. Being aware of the metrics from this pillar and acting accordingly is what makes the difference between an average ecommerce business and a successful one.
Net promoter score (NPS) — this tool helps you measure how willing your customers are to recommend your products or services to others; these valuable insights will help you categorize customers in three groups:
- Promoters — your most loyal customers
- Passives — customers that are satisfied with your service but not happy enough to be your brand ambassadors
- Detractors — red flag, unhappy customers who are not just unlikely to buy from you again, but they may even discourage others from doing so.
Besides this one, metrics like newsletter subscriptions and the number of participants in your loyalty programs are also indicators that can help you measure brand advocacy.
Now that we’ve covered basic ecommerce metrics it’s time to move to more advanced ecommerce analytics.
The power of Enhanced Ecommerce in Google Analytics
Besides the standard ecommerce tracking, Google has an Enhanced Ecommerce plugin that is not fully utilized by companies, despite the fact that it’s packed with tons of valuable and free data.
Even though it’s not a plug-and-play solution, and it takes some time to set up the tracking, the value that you receive from having the additional data is worthwhile. For a more detailed explanation of the technical aspects of the integration, you can check on Google Developers.
Some ecommerce platforms like Shopify, Magento, and Woocommerce offer a built-in integration.
Unlike the standard data you get from Google Analytics that is collected after purchase, with the Enhanced Ecommerce tool, you get information from across the entire customer journey. This
allows you to generate business insights that will help you grow your online store, improve the performance of your products, as well as your marketing efforts.
What are some of the insights you can get from Enhanced Ecommerce?
The reports you can get from the Enhanced Ecommerce analytics can be categorized into three groups: User behavior data, product data, and marketing data.
User behavior data
The reports from this category give you information on user behavior during the purchasing process as well as throughout the checkout.
Shopping Behavior Report — gives you insight on the number of sessions at each stage of the funnel. Starting from the visitors that only view your products, moving to those who add products to their cart, how many initiated checkout, and lastly, how many sessions finish with a transaction. This report gives you a clear picture of how visitors move down the funnel and helps you identify what you can fix in the process to increase the number of transactions.
Checkout Behavior Report — this report is similar to the Shopping Behavior report, but it’s focused on the steps included in the checkout process. Using this report, you can easily track how customers behave during checkout and at what point most of them decide to give up.
Product data
Using the Enhanced Ecommerce tool, marketers can collect invaluable information related to the products and their performance.
Product Performance Report — there are two types of views included in this report:
- Summary view — here you have a sales performance section and a shopping behavior section. In the sales performance section, you can find insights like product revenue, unique purchases, quantity, average price, average quantity, and product refund amount. In the shopping behavior section, you can find the basket-to-detail-rate (number of products added per number of product detail views) and buy-to-detail-rate (number of products purchased per number of product detail views).
- Shopping behavior view — if you navigate to the shopping behavior view, you can find data related to the engagement with your products, including product list views, product detail views, product adds to basket, product removes from basket, product checkouts, and unique purchases.
Sales Performance Report — in this report, you can find information about revenue, tax for your online transactions, delivery charges, refund amount, and number of products sold. You can track sales by transaction ID or by date.
Product List Performance Report — this report gives great insights into related products, cross-selling, and up-selling. Based on the grouping of products on your site, you will be able to collect information about product list views, product list clicks, and product list CTR.
Marketing data
Besides the information you collect about shopping behavior and product performance, the Enhanced Ecommerce tracking allows you to measure internal and external marketing efforts.
Internal Promotion Report — here you can find insights related to internal promotion tools like banners placed on one page of your website that lead to another section. In this report, you can see metrics like internal promotion views, internal promotion clicks, internal promotion CTR, transactions, revenue, and transaction per internal promotion click.
Order Coupon Report — this report shows metrics related to the performance of your order coupons in terms of revenue, transactions, and average value.
Product Coupon Report — similar to the previous report, this one gives you insights related to the performance of your product coupons in terms of revenue, unique purchases, and product revenue per purchase.
Affiliate Code Report — in this report, you can find information on how affiliate sites contribute to the success of your online store. Here you can track small business metrics that show revenue, transactions, and average order value.
9 benefits of ecommerce analytics
Today’s customers make informed decisions. They research products, compare prices, read reviews, and look for unique experiences before they decide to click the add to cart button. Being able to understand their behavior will help you stay ahead of the game.
Here are nine benefits that you can get out of ecommerce analytics:
1. Data-driven product development
Customers have more options and control than ever before. The number of choices leads to high expectations, and companies will need to dramatically improve their capabilities to keep up with the accelerating expectations of consumers. Having evidence of consumers’ likes and dislikes and capitalizing on that knowledge in the product development process is the key to creating a product that customers will love.
2. Good inventory management
The continuity of your online store depends on how good your ecommerce inventory management is. Knowing where your products are and when is the right time to reorder will save you a lot of headaches around order fulfillment. Besides this, ecommerce analytics can help you forecast and plan inventory for the upcoming period.
3. Cross-sell and up-sell to existing customers
Companies often underestimate the power of cross-selling and up-selling to customers. As reported by Forbes, it can cost five times more to attract a new customer than it does to retain an existing one. On top of that, 65% of a company’s business comes from existing customers, so using ecommerce data for a retargeting strategy can be a gold mine.
4. Gather user behavior data
You must stay on top of rapidly changing consumer preferences and expectations. The best way to do so is by gathering user behavior data and understand their demands, expectations, and pain points. If you want to stay relevant, you have to adopt a consumer-first mentality.
5. Personalized shopping experience (product recommendations)
In ecommerce, one size fits none. Epsilon research shows that 80% of consumers are more likely to make a purchase when brands offer a personalized experience, and 90% indicate that they find personalization appealing. In this new world, personalization is far more than simply tailoring assortments. Using ecommerce analytics, you will be able to predict the needs of individual consumers and make relevant product recommendations.
6. Engaging user experience
Customer experience is the new brand currency. Besides price and quality, you need to offer engaging user experience to keep customers interested. Looking at the data, you can see how much time customers spend on your site, what features capture their
attention, and what you can improve to create inspirational, exciting, simple, and frictionless user experience to meet consumer’s ever-changing needs.
7. Optimized product portfolio
In every product portfolio there are “zeros” and “heroes”—and that’s fine. Ignoring that fact is what’s not okay. That’s why ecommerce analytics is far more than just numbers. Use the data to analyze what are your bestsellers, and what are the products that don’t sell. You can always dig deeper and find out the reason why some products stay forever on your virtual shelf and take advantage of the insights you gather to optimize your product portfolio.
8. Maximize return on ad spend (ROAS)
Using ecommerce analytics can help you find out if you have a leaky bucket and what you can do to maximize ad spends. Instead of wasting money on ads that don’t work, you can focus on the right ads to the right target audience.
9. Satisfied customers
Customers stick to companies that treat them like people and not like numbers. The ultimate goal of ecommerce analytics is gathering data to understand customers and optimize products and processes to meet and exceed customers’ expectations.
Ecommerce analytics best practices
Data analytics plays an increasingly crucial role in the ecommerce ecosystem. Here are five best practices that will help you focus on things that matter and user ecommerce analytics to increase your online sales.
1. Gather scattered marketing data across channels and platforms
Having all your data scattered across channels and platforms can feel overwhelming. Your sales data may live in Shopify, Magento, or any other ecommerce platform, your paid ad data is across Facebook, Google Ads, Taboola, and Outbrain, on top of that you have your Google Analytics Enhanced Ecommerce data, customer relationship management platforms, email providers, and tons of other data. Copy/pasting all that information from native analytics platforms or dozens of CSVs can be a real nightmare.
The good news is that there is a smarter and easier way to consolidate all this data without wasting hours. Thanks to pre-built data connectors, you can pull data from any source directly into Google Sheets, Excel, or Google Data Studio. That way, instead of spending hours on consolidating data and shuffling between platforms and reports, you can focus on analyzing your marketing data.
With smart ecommerce analytics tracking, you will be able to break down data silos and boost productivity, efficiency, and business agility.
2. Understand the numbers and the customers
Gathering data just for the sake of having it is a waste of time and money. You should be able to understand the numbers through the prism of consumer behavior. Marketing tools give a vast amount of information, but they are not built for cross-channel reporting. That said, when you are looking at data in isolation, you can’t see the big picture, and you can easily make mistakes and wrong decisions. As your marketing stack grows, having all your data in one place will give you a clear picture of users’ behavior and detect areas for improvement.
3. Know when to act
Timely actions are the key to ecommerce success. By using rule-based alerts when a specific product/category/campaign is performing well, or inventory is running low, you can react accordingly. As a result, you’ll be able to double down on things that are working well and eliminate campaigns that are not bringing you the results you were after. With custom alerts sent directly to your inbox, you’ll know when is the right time to act.
4. Automate ecommerce dashboards
Once you have all the data in place, it’s time for automation. Instead of pulling manual reports, you can set your reports to refresh automatically while you focus on data analysis and providing value for the consumers. Besides saving you time and energy, automation minimizes any room for mistakes. This will help you create a data-driven culture, where you reduce reporting time and focus on the analysis and insights.
5. Share analytics for streamlined communication between team members
Having a transparent and streamlined communication across the company is crucial for informed decision making. However, with all the platforms companies use nowadays, it’s hard to share data with team members. Since sharing knowledge across departments is the foundation of business growth, having centralized data that’s easy to understand and share across the team will pay off in the long run.
Wrapping up
Creating a competitive customer experience means incorporating ecommerce analytics throughout the customer lifecycle. These insights will provide direction to optimize consumer experiences across discovery, acquisition, conversion, retention, and advocacy.
Ready to gather all your marketing metrics in one place and simplify ecommerce analytics?
Turn your marketing data into opportunity
We streamline your marketing data so you can focus on the insights.